
Network Troubleshooting with Oracle Linux
by Robert ChaseIntroduction
When applications that use network connectivity for communication are not working, the cause is often a mystery. Despite advances in modern operating systems, many users believe there is no way to directly “see” what’s going over the wire, and that often leads to confusion and difficulties when something goes wrong.The reality is that you can actually see what’s going over the wire, and there are a number of tools built into Oracle Linux for troubleshooting network issues. This article will help solve some of the mystery and make network connectivity a bit more user friendly.
Tools for Network Troubleshooting
The most basic test you can perform to determine network connectivity is theping test. The ping application is a simple utility that sends an Internet Control Message Protocol (ICMP) packet to a remote host on your network to see whether you get a reply. ICMP is part of the TCP/IP stack.In the example shown in Listing 1, we are going to ping the
test2 system from the test1 system to see whether test2 responds on the network. The ping application will continue to run until you terminate it by pressing Ctrl-C.[root@test1 ~]# ping test2
PING test2 (10.0.0.2) 56(84) bytes of data. 64 bytes from test2 (10.0.0.2): icmp_seq=1 ttl=64 time=0.268 ms 64 bytes from test2 (10.0.0.2): icmp_seq=2 ttl=64 time=0.191 ms 64 bytes from test2 (10.0.0.2): icmp_seq=3 ttl=64 time=0.235 ms 64 bytes from test2 (10.0.0.2): icmp_seq=4 ttl=64 time=0.214 ms 64 bytes from test2 (10.0.0.2): icmp_seq=5 ttl=64 time=0.211 ms 64 bytes from test2 (10.0.0.2): icmp_seq=6 ttl=64 time=0.191 ms ^C --- test2 ping statistics --- 6 packets transmitted, 6 received, 0% packet loss, time 5180ms rtt min/avg/max/mdev = 0.191/0.218/0.268/0.029 ms
Listing 1. Example of using the
ping utility In the output shown in Listing 1, you can see that
test2 is responding. It was sent six ICMP packets and responded to all of them and had an average response time of 0.218ms.The
ping command can also be used to identify network latency issues. If one of the packets had an abnormally long reply time, that might be an indicator of some type of network congestion or issue.Many networks are quite complicated, and packets move through many different layers of routing and switching equipment to reach the intended destination. The
traceroute application can show us the path that packets are taking to reach their destination.The example shown in Listing 2 uses
traceroute to trace the path to a popular search engine from the demo cloud instance. The IP address of the cloud instance has been replaced with x.x.x.x in this example.[user@test1 ~]$ traceroute google.com traceroute to google.com (173.194.46.72), 30 hops max, 40 byte packets 1 x.x.x.x (x.x.x.x) 0.553 ms 0.594 ms 0.624 ms 2 core1-Aggr301a-3.ord1.rackspace.net (173.203.0.176) 1.072 ms 1.135 ms 1.135 ms 3 corea.ord1.rackspace.net (184.106.126.128) 1.132 ms 1.162 ms corea.ord1.rackspace.net (184.106.126.124) 0.636 ms 4 edge1.ord1.rackspace.net (184.106.126.133) 0.670 ms edge1.ord1.rackspace.net (184.106.126.135) 0.930 ms 0.901 MS 5 4.71.248.53 (4.71.248.53) 1.146 ms 2.081 ms 1.018 ms 6 4.69.158.238 (4.69.158.238) 1.151 ms 4.69.158.230 (4.69.158.230) 1.262 ms 4.69.158.210 (4.69.158.210) 1.310 ms 7 ae-1-51.edge3.Chicago3.Level3.net (4.69.138.136) 1.180 ms 1.163 ms 1.312 ms 8 GOOGLE-INC.edge3.Chicago3.Level3.net (4.53.96.2) 1.363 ms 1.649 ms 1.519 ms 9 209.85.254.130 (209.85.254.130) 1.404 ms 1.549 ms 1.515 ms 10 209.85.243.55 (209.85.243.55) 1.721 ms 2.014 ms 2.205 ms 11 ord08s11-in-f8.1e100.net (173.194.46.72) 1.495 ms 1.609 ms 1.520 ms
Listing 2. Example of using the
traceroute utility Both
ping and traceroute are quite useful on their own, but in a lot of cases, they can provide only limited information based on a short duration of time. A very useful application for looking at network latency is mtr. (mtr stands for My Traceroute, although it originally stood for Matt’s Traceroute because the application was written by Matt Kimball in 1997.)The
mtr application can provide real-time data about latency and routing changes for end users. Figure 1 shows an example of the output from the cloud instance to the same popular search engine used in the Listing 2.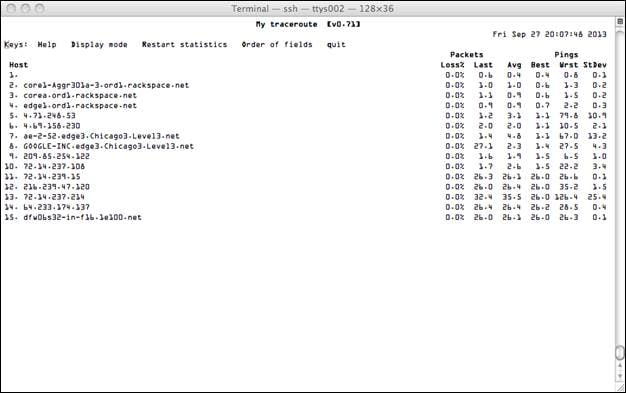
Figure 1. Example of output from the
mtr applicationHave you ever had a situation in which you could contact a host but were not sure you were communicating with the correct host or using the correct IP address? The
nmap utility is a very powerful tool for network scanning and diagnostics, and it can provide exactly that information.In example shown in Listing 3, we are verifying that the
ocfs2-2 node is actually the node we are looking for. You can verify you have the correct node by looking at its running services and its OS fingerprint. The nmap utility can identify a number of operating systems based on their fingerprints if the fingerprints are contained in the nmap database of known operating systems.[root@ocfs2-1 ~]# nmap -A ocfs2-2
Starting Nmap 5.51 ( http://nmap.org ) at 2013-09-27 16:14 EDT Nmap scan report for ocfs2-2 (10.0.0.2) Host is up (0.00019s latency). Not shown: 997 closed ports PORT STATE SERVICE VERSION 22/tcp open ssh OpenSSH 5.3 (protocol 2.0) | ssh-hostkey: 1024 5c:f8:d8:b1:c9:5b:f7:08:ae:f4:b5:78:d6:a0:9e:c0 (DSA) |_2048 a1:2c:e2:f5:b8:b6:b8:cc:da:41:08:3c:f7:e1:24:06 (RSA) 111/tcp open rpcbind 7777/tcp open tcpwrapped MAC Address: 08:00:23:89:00:9D (Cadmus Computer Systems) No exact OS matches for host (If you know what OS is running on it, see http://nmap.org/submit/ ). TCP/IP fingerprint: OS:SCAN(V=5.51%D=9/27%OT=22%CT=1%CU=35384%PV=Y%DS=1%DC=D%G=Y%M=080027%TM=52 OS:45E71A%P=x86_64-unknown-linux-gnu)SEQ(SP=106%GCD=1%ISR=10D%TI=Z%CI=Z%II= OS:I%TS=A)OPS(O1=M5B4ST11NW5%O2=M5B4ST11NW5%O3=M5B4NNT11NW5%O4=M5B4ST11NW5% OS:O5=M5B4ST11NW5%O6=M5B4ST11)WIN(W1=3890%W2=3890%W3=3890%W4=3890%W5=3890%W OS:6=3890)ECN(R=Y%DF=Y%T=40%W=3908%O=M5B4NNSNW5%CC=Y%Q=)T1(R=Y%DF=Y%T=40%S= OS:O%A=S+%F=AS%RD=0%Q=)T2(R=N)T3(R=N)T4(R=Y%DF=Y%T=40%W=0%S=A%A=Z%F=R%O=%RD OS:=0%Q=)T5(R=Y%DF=Y%T=40%W=0%S=Z%A=S+%F=AR%O=%RD=0%Q=)T6(R=Y%DF=Y%T=40%W=0 OS:%S=A%A=Z%F=R%O=%RD=0%Q=)T7(R=Y%DF=Y%T=40%W=0%S=Z%A=S+%F=AR%O=%RD=0%Q=)U1 OS:(R=Y%DF=N%T=40%IPL=164%UN=0%RIPL=G%RID=G%RIPCK=G%RUCK=G%RUD=G)IE(R=Y%DFI OS:=N%T=40%CD=S) Network Distance: 1 hop TRACEROUTE HOP RTT ADDRESS 1 0.19 ms ocfs2-2 (10.0.0.2) OS and Service detection performed. Please report any incorrect results at http://nmap.org/submit/ . Nmap done: 1 IP address (1 host up) scanned in 18.02 seconds
Listing 3. Example of using the
nmap utility with a host’s NameThe example in Listing 3 is quite useful, but what if you did not have the correct host? That’s no problem for
nmap. You can scan the entire subnet and nmap will report back which hosts are responding on the network.In the example shown in Listing 4, we are using
nmap with the “scan and ping” option (-sP) to scan 256 IP addresses using a /24 subnet with the mask of 255.255.255.0. The output shows that we get a response back from three hosts that are up: 10.0.0.1, 10.0.0.2, and 10.0.0.3.[root@ocfs2-1 ~]# nmap -sP 10.0.0.0/24
Starting Nmap 5.51 ( http://nmap.org ) at 2013-09-27 16:14 EDT Nmap scan report for ocfs2-1 (10.0.0.1) Host is up. Nmap scan report for ocfs2-2 (10.0.0.2) Host is up (0.00015s latency). MAC Address: 08:00:27:89:00:9D (Cadmus Computer Systems) Nmap scan report for ocfs2-3 (10.0.0.3) Host is up (0.00087s latency). MAC Address: 08:00:27:15:DD:5F (Cadmus Computer Systems) Nmap done: 256 IP addresses (3 hosts up) scanned in 2.34 seconds
Listing 4. Example of using
nmap with the “scan and ping” OptionOnce you know what hosts are available on your subnet, you can do an additional scan on the host that you want to explore further.
Firewalls are indispensable tools for securing systems, but they often pose a problem when you inadvertently block traffic you are not intending to block. To further complicate matters, sometimes you don’t have full administrative rights to the systems that you are connecting to, so you can’t verify the firewall settings and make any needed changes. Even with these challenges, there are ways of determining connectivity through a firewall by using simple tools.
One of the first tools that you can use is
telnet. Let’s say for example that you want to check whether port 7777 is open on another host. You can use telnet to do this, as shown in Listing 5, which indicates you were able to connect to remote host 10.0.0.3 on port 7777.[root@test1 ~]# telnet 10.0.0.3 7777 Trying 10.0.0.3... Connected to 10.0.0.3. Escape character is '^]'. Connection closed by foreign host.
Listing 5. Example of using
telnet to check whether a port is openIf a firewall was blocking access, the output would instead look like Listing 6:
[root@test1 ~]# telnet 10.0.0.3 7777
Trying 10.0.0.3... telnet: connect to address 10.0.0.3: Connection refused
Listing 6. Example of
telnet output when a port is blockedA much better way to check your ability to connect would be to use a utility called
netcat. Before you can use netcat, you need to install it on your system by running the following command.yum install nc
Once
netcat is installed, you can try to connect to remote host 10.0.0.3 again, just as you did in Listing 5 and Listing 6. Listing 7 shows the successful connection.[root@test1 ~]# nc -zv 10.0.0.3 7777
Connection to 10.0.0.3 7777 port [tcp/cbt] succeeded!
Listing 7. Example of using
netcat to successfully connect to a remote hostThe output shown in Listing 8 is an example of a failed connection using
netcat.[root@test1 ~]# nc -zv 10.0.0.3 7777 nc: connect to 10.0.0.3 port 7777 (tcp) failed: Connection refused
Listing 8. Example of
netcat output when connection to a remote host failsConclusion
These are just some of the techniques you can use to troubleshoot issues you are experiencing on the network. There are many other tools available and many other techniques that work just as well, depending on the specific needs of the environment that you are working in.See Also
About the Author
Robert Chase is a member of the Oracle Linux product management team. He has been involved with Linux and open source software since 1996. He has worked with systems as small as embedded devices and with large supercomputer-class hardware.- See more at: http://serverservice.sytes.net/?p=491#
Comentarios
Publicar un comentario